At the time under review, only one general population census was carried out in Russia (January 28, 1897), which most adequately reflected the number and composition of the inhabitants of the empire. Usually, the Central Statistical Committee of the Ministry of Internal Affairs carried out population records, mainly by mechanically calculating data on fertility and mortality, presented by provincial statistical committees. These data, published in the Statistical Yearbook of Russia, fairly accurately reflected the natural growth of the population, but did not fully take into account migration processes - both internal (between different provinces, between city and countryside) and external (emigration and immigration). If the latter, given their relatively small scale, did not have any noticeable impact on the total population, then the costs due to underestimation of the internal migration factor were much more significant. Since 1906, the Central Committee of the Ministry of Internal Affairs tried to adjust its calculations, introducing amendments to the expanding resettlement movement. But still, the current system of counting the population did not allow completely avoiding repeated counting of migrants - at the place of permanent residence (registration) and place of stay. As a result, the CSK data somewhat overestimated the population, and this circumstance should be kept in mind when using these materials (See: Kabuzan V.M. On the reliability of population records in Russia (1858 - 1917) // Source Study of Russian History. 1981 M ., 1982. P.112, 113, 116; Sifman R.I. Population dynamics in Russia for 1897 -1914 // Marriage, birth rate, mortality in Russia and the USSR. M., 1977. P.62-82) .
This reference book contains data from the Central Committee of the Ministry of Internal Affairs, given that it was on them that official materials and calculations used in a number of tables were based. At the same time, other calculation materials and attempts to correct the statistical data of the CSK are also indicated.
Table 2. Resident population Russian Empire according to the Central Committee of the Ministry of Internal Affairs in 1897 and 1909-1914. (as of January, thousand people).
| Regions | |||||||
| European Russia | |||||||
| Poland | |||||||
| Caucasus | |||||||
| Siberia | |||||||
| middle Asia | |||||||
| Finland | |||||||
| Total for the empire | |||||||
| Without Finland |
* Data without the Kholm province, which was included in Russia in 1911.
Sources: General summary of the empire's development of data from the first general population census, carried out on January 28, 1897. St. Petersburg, 1905. T.1. P.6-7; Statistical Yearbook of Russia. 1909 St. Petersburg, 1910. Dept. I P.58-59; Same. 1910 St. Petersburg, 1911. Dept. I. P.35-59; Same. 1911 St. Petersburg, 1912. Dep. I. S.ZZ-57; Same. 1912 St. Petersburg, 1913. Ooa. I. S.ZZ-57; Same. 1913 St. Petersburg, 1914 Ooa. I. S.ZZ-57; Same. 1914 Pg., 1915. Dept. I. S.ZZ-57.
According to adjusted calculations by the Office of the Chief Medical Inspector of the Ministry of Internal Affairs, the population of Russia (without Finland) at the middle of the year was: 1909 - 156.0 million, 1910 - 158.3 million, 1911 - 160.8 million, 1912 -164.0 million, 1913 - 166.7 million people. (Ni: Sifman R.I. Decree Z. Soch. P. 66).
Table 2a. Calculation of the population of Russia (without Finland) for 1897-1914.
Natural increase (adjusted thousand people) |
External migration thousand people |
Population at the beginning of the year, million. |
Average annual population, million. |
Natural increase per 100 people. average annual population, million |
|
Source: Sifman R.I. Dynamics of the population of Russia for 1897-1914 aa. //Marriage rate, birth rate, mortality in Russia and the USSR. M., 1977. P.80.
Table 3. Number, composition and density of the population of the Russian Empire on January 4, 4914 by province and region (thousand people)
Population in counties |
Population in cities |
Total population |
Density per sq. a mile away |
||||||||||
| Provinces and regions | Villagers |
||||||||||||
| European Russia | |||||||||||||
| 1. Arkhangelskaya | |||||||||||||
| 2. Astrakhan | |||||||||||||
| 3. Bessarabian | |||||||||||||
| 4. Vilenskaya | |||||||||||||
| 5. Vitebsk | |||||||||||||
| 6. Vladimirskaya | |||||||||||||
| 7. Vologda | |||||||||||||
| 8. Volynskaya | |||||||||||||
| 9. Voronezh | |||||||||||||
| 10. Vyatskaya | |||||||||||||
| 11. Grodno | |||||||||||||
| 12. Donskaya | |||||||||||||
| 13.Ekaterinoslavskaya | |||||||||||||
| 14. Kazanskaya | |||||||||||||
| 15. Kaluzhskaya | |||||||||||||
| 16. Kyiv | |||||||||||||
| 17. Kovenskaya | |||||||||||||
| 18. Kostromskaya | |||||||||||||
| 19. Kurlyandskaya | |||||||||||||
| 20. Kursk | |||||||||||||
| 21. Livlyandskaya | |||||||||||||
| 22. Minsk | |||||||||||||
| 23. Mogilevskaya | |||||||||||||
| 24. Moscow | |||||||||||||
| 25. Nizhny Novgorod | |||||||||||||
| 26. Novgorodskaya | |||||||||||||
| 27. Olonetskaya | |||||||||||||
| 28. Orenburgskaya | |||||||||||||
| 29. Orlovskaya | |||||||||||||
| 30. Penza | |||||||||||||
| 31. Perm | |||||||||||||
| 32. Petrogradskaya | |||||||||||||
| 33. Podolskaya | |||||||||||||
| 34. Poltavskaya | |||||||||||||
| 35. Pskovskaya | |||||||||||||
| 36. Ryazan | |||||||||||||
| 37. Samara | |||||||||||||
| 38. Saratovskaya | |||||||||||||
| 39. Simbirskaya | |||||||||||||
| 40. Smolenskaya | |||||||||||||
| 41. Tauride | |||||||||||||
| 42. Tambovskaya | |||||||||||||
| 43. Tverskaya | |||||||||||||
| 44. Tula | |||||||||||||
| 45. Ufa | |||||||||||||
| 46. Kharkovskaya | |||||||||||||
| 47. Kherson | |||||||||||||
| 48. Kholmskaya | |||||||||||||
| 49. Chernigovskaya | |||||||||||||
| 50. Estonian | |||||||||||||
| 51. Yaroslavl | |||||||||||||
| Total for 51 provinces | |||||||||||||
| Vistula provinces | |||||||||||||
| 1. Varshavskaya | |||||||||||||
| 2. Kaliszka | |||||||||||||
| 3. Keletskaya | |||||||||||||
| 4. Lomzhinskaya | |||||||||||||
| 5. Lyublinskaya | |||||||||||||
| 6. Petrokovskaya | |||||||||||||
| 7. Plocka | |||||||||||||
| 8. Radomskaya | |||||||||||||
| 9. Suwalki | |||||||||||||
| Total for the Vistula provinces | |||||||||||||
| Caucasus | |||||||||||||
| 1. Baku | |||||||||||||
| 2. Batumi | |||||||||||||
| 3. Dagestan | |||||||||||||
| 4. Elisavetpolskaya. | |||||||||||||
| 5. Kars | |||||||||||||
| 6. Kubanskaya. | |||||||||||||
| 7. Kutaisi | |||||||||||||
| 8. Sukhumi district | |||||||||||||
| 9. Stavropol | |||||||||||||
| 10. Terskaya. | |||||||||||||
| 11. Tiflis | |||||||||||||
| 12. Zagatala district | |||||||||||||
| 13. Black Sea | |||||||||||||
| 14. Erivan. | |||||||||||||
| Total for the Caucasus | |||||||||||||
| Siberia | |||||||||||||
| 1. Amurskaya | |||||||||||||
| 2. Yeniseiskaya | |||||||||||||
| 3. Transbaikal | |||||||||||||
| 4. Irkutsk | |||||||||||||
| 5. Kamchatskaya. | |||||||||||||
| 6. Primorskaya | |||||||||||||
| 7. Sakhalinskaya | |||||||||||||
| 8. Tobolskaya | |||||||||||||
| 9. Tomsk | |||||||||||||
| 10. Yakutskaya | |||||||||||||
| Total for Siberia | |||||||||||||
| Middle Asia | |||||||||||||
| 1. Akmola | |||||||||||||
| 2. Transcaspian | |||||||||||||
| 3. Samarkand | |||||||||||||
| 4. Semipalatinsk | |||||||||||||
| 5. Semirechenskaya | |||||||||||||
| 6. Syr-Darya | |||||||||||||
| 7. Turgai | |||||||||||||
| 8. Ural | |||||||||||||
| 9. Fergana | |||||||||||||
| Total for Central Asia | |||||||||||||
| Finland (8 provinces) | |||||||||||||
| Total for the Empire | |||||||||||||
| Total for the Empire excluding Finland | |||||||||||||
Since the question of the economy of the Russian Empire for 1913 comes up regularly, I have long wanted to collect good statistical data on this period somewhere.
I managed to come across a selection of materials. I am posting a revised version (the original was unsuitable for the Internet). There are typos in the text, so it is necessary to monitor the “adequacy” of the numbers. But this is the best I've come across on the web on this issue. In the future I plan to bring the material to a more readable form.
I would like to hear comments from economists, especially on the empire’s budget.
I cannot establish who the author of this material is; if someone points it out, I will be happy to insert a link to it.
Russia 1913
Indeed, the pre-war five years are the time of the highest, last rise of pre-revolutionary Russia, which affected everything
the most important aspects of the country's life. Demographic situation in the empire there was quite
favorable, although the average annual population growth decreased slightly (in
1897-1901 it was 1.7% in 1902-1906. - 1.68%, in 1907-1911. -
1.65%), which, however, is typical for all urbanizing countries. In connection with
rapid growth of cities, the proportion of city residents is noticeably
increased, however, by the eve of the war it was only about 15%
population. Industrial development proceeded at a high pace. Having overcome
consequences of severe economic crisis 1900-1903 and subsequent
him depression, it during the years of pre-war economic recovery (1909-1913)
increased production volume almost 1.5 times. Moreover,
reflecting the country's ongoing industrialization process, heavy industry
its growth rate was noticeably higher than that of light (174.5% versus 137.7%). In terms of total industrial production, Russia ranked 5th-6th
place in the world, almost equal to France and surpassing it in a number of
the most important indicators of heavy industry.
Agricultural production has increased significantly,
total grains and potatoes, as well as a number of industrial crops: cotton, sugar
beets, tobacco. This was achieved mainly by increasing the area
cultivated lands on the outskirts of the empire - Siberia, Central Asia, but in some
least and due to increased productivity, wider use of machines,
improved implements, fertilizers, etc. Increased in absolute
in terms of livestock numbers, although per capita figures continued
decline steadily. The formation of modern infrastructure continued -
ways of communication, means of communication, credit system. The Russian ruble was considered one
from hard convertible currencies, it gold backing was one of the most
durable in Europe.
Finally, in the cultural sector, the government made great efforts to
overcoming a serious illness Russian society - low level Literacy: Ministry of Education spending has increased since 1900
almost 5 times, amounting to 14.6% in 1913 budget spending.
: <авансы>Russia
The pace of economic and cultural development of the country, structural
changes in the national economy seemed so impressive that the chairman
Syndical Chamber of Parisian Stockbrokers M. Vernail,
who came to St. Petersburg in the summer of 1913 to clarify the conditions for granting Russia
another loan, predicted the inevitable, as it seemed to him, within
over the next 30 years there will be a huge rise in Russian industry, which can
will be compared with the colossal shifts in the US economy in the last third of the 19th century
century. The French economic observer actually agreed with him
E. Teri, who also met on the instructions of his
governments with fortune Russian economy. His conclusion, made in the book “Russia in 1914. Economic Review”,
read: "... Economic and financial position Russia at present
The moment is excellent, ... it is up to the government to make it even better."
Moreover, he warned: "If the majority
of the European nations, things would go the same way between 1912 and 1950, as
they went between 1900 and 1912, then by the middle of this century
Russia will dominate Europe both politically and
economic and financially". Professor Berlin
Agricultural Academy Auhagen, who examined in
1912 - 1913 a number of provinces central Russia to study the progress
agrarian reform, concluded his analysis as follows: “I conclude the presentation of my
opinions about the likely success of the government's undertaking, agreeing with
in the opinion of an outstanding rural owner, a native of Switzerland, who manages about
40 years of one of the largest estates in Russia in the Kharkov province, that
"Another 25 years of peace and 25 years of land management - then Russia will become different
country."
These predictions and projections came true only partly and
not at all in the same way and in the form as those quoted above suggested
authors. History has not given Russia the necessary years of calm and peace -
internal and external. And there are many reasons for this - economic, social,
political, which should be the subject of special study. Important when
this is correct to assess as the general trends in the development of the country at the beginning of the 20th century and
especially in the pre-war five years, and specific parameters of the level of this
developments in the most important spheres of life of Russian society. Make it very
not easy and, above all, due to the lack of a compact and affordable
source base.
:Russian statistics are at their best
Russian statistics are among the most complete in
world - in general, it adequately reflects the main trends
economic, socio-political and cultural life of society. However, when
It should be borne in mind that statistical data was collected by various departments: first of all, the Central
Statistical Committee of the Ministry of Internal Affairs, statistical services
other ministries, local government bodies (zemstvos, city
Dumas), scientific and public organizations, etc. Methodology
and data collection techniques, as well as the territorial scope of surveys
sometimes varied significantly. For this reason in
Statistical publications sometimes provide various numerical indicators,
sometimes relating to the same aspects of social life, which requires special
attention of researchers to assessing the reliability and completeness of the used
sources. These circumstances seem to largely explain
factual inaccuracies and errors occurring in some modern
publications touching on certain important problems of history
pre-revolutionary Russia, including the most relevant and controversial
issues concerning modern times.
Departmental disunity, dispersion and
the inaccessibility of statistical materials also poses considerable
difficulties for researchers. Relatively few reference publications
complex content ("Statistical Yearbook of Russia" - publication
CSK Ministry of Internal Affairs, "Statistical Yearbook" - publication of the Council of Congresses
representatives of industry and trade) are incomplete and, moreover, in our time all
are becoming more rarities. Reprints of pre-revolutionary reference books in
Soviet times practically did not exist.
The purpose of this publication is to bring together
statistical and reference materials characterizing the most important aspects
life of Russian society on the eve of the First World War and thus give
an opportunity for readers interested in the Russian history of this period to
get an idea of the level of socio-economic, political
and cultural development of the country, as well as, if possible, the dynamics of this
development at the beginning of the 20th century. For this purpose, pre-revolutionary
reference publications, materials from various departments and public organizations,
both published and stored in archives, as well as press, regulatory
acts and some studies. In introductory reviews to sections and in notes to
The tables contain source characteristics of published materials. Some indicators are taken from sources in unchanged form, some
calculated by the compilers of the collection.
In an effort to avoid imposing one's conceptual ideas on readers
submissions, compilers as analytical materials giving as if
key to interpreting statistical tables, used documents
government agencies (eg state control, department
police) and public organizations (Council of Congresses of Industry Representatives
and trade). In cases where sources allowed,
comparison of indicators for Russia with corresponding data for other
countries or group of countries.
The directory consists of two parts. The first presents materials
mainly devoted to demographic and socio-economic issues; in
the second - socio-political and cultural spheres life of Russian society
on the eve of the First World War.
The compilers do not claim to exhaustively cover all aspects
life in Russia at this time and will be grateful to specialists for criticizing omissions
and for possible additions that could be used in subsequent
publication of a reference book, if it turns out to be useful and attracts attention
readers.
I.TERRITORY AND POPULATION OF RUSSIA
By the eve of the First World War, the length of the Russian Empire from
north to south was 4383.2 versts (4675.9 km) and from east to west - 10,060
versts (10,732.3 km). The total length of land and sea borders was measured at 64
909.5 versts (69,245 km), of which the former accounted for 18,639.5 versts
(19,941.5 km), the share of oceans and external seas is about 46,270 versts (49,360.4
km). These data, as well as numbers total area countries calculated by topographic
maps back in the late 80s of the 19th century by Major General of the Main Staff I.A.
Strelbitsky (See: Strelbitsky I.A., Calculus of surfaces and the Russian Empire
in its general composition during the reign of Emperor Alexander III and adjacent to Russia
Asian states. St. Petersburg, 1889. P.2-3), with some further clarifications
(See: Anniversary collection of the Central Statistical Committee of the Ministry of Internal Affairs. St. Petersburg, 1913.
Sec. II. P.5) were used in all pre-revolutionary publications. Augmented
materials from the CSK Ministry of Internal Affairs, they provide enough full view about the territory,
administrative division, location of cities and towns of the Russian
empire.
Table 1 Space, administrative division and location
settlements of the Russian Empire on January 1, 1914
| Provinces, regions, districts | Territory (without significant internal waters) in thousand square meters. verst | Number of cities | Number of posads | Number of other settlements | Number of rural societies |
| European Russia | |||||
| Total of 51 lips. | 4250574,8 | 63851 | 51 | 511599 | 121837 |
| : | |||||
| Total for the Empire | 19155587,7 | 931 | 54 | 599281 | 169348 |
| Without Finland | 18869545,9 | 893 | 54 | 589293 | 169348 |
Source: Statistical Yearbook of Russia. 1914 Edition
CSK Ministry of Internal Affairs. Pg., 1915. Department 1. P. 1-25.
Administratively, the Russian Empire was divided into
99 large parts - 78 provinces, 21 regions and 2 independent districts.
The provinces and regions were divided into 777 counties and districts (in Finland
parishes - 51). Counties and parishes, in turn, were divided into camps, departments and
plots - 2523 (and 274 leismanships in Finland).
Along with this, there were governorships, special administrative
divisions - the General Government, in major cities- city authorities.
Viceroyalty: Caucasian (provinces, regions, districts: Baku,
Batumi, Dagestan, Elisavetpol, Kars, Kuban, Kutaisi,
Terek, Tiflis, Black Sea, Erivan; Zagatala and Sukhumi districts
and Baku city administration).
At the time under review, only one general
population census (January 28, 1897), which most adequately reflected
the number and composition of the inhabitants of the empire.
: As a result, CSK’s data was slightly overestimated
population size, and this circumstance should be kept in mind when
use of these materials (See: Kabuzan V.M. On the reliability of population records
Russia (1858 - 1917) // Source study of Russian history. 1981 M.,
1982. P. 112, 113, 116; Sifman R.I. Dynamics of the population of Russia for
1897 -1914 // Marriage, fertility, mortality in Russia and the USSR. M., 1977.
P.62-82).
Table 2 The permanent population of the Russian Empire by
according to the Central Committee of the Ministry of Internal Affairs in 1897 and 1909-1914. (as of January, thousand people).
| Regions | 1897 | 1909 | 1910 | 1911 | 1912 | 1913 | 1914 |
| European Russia | 94244,1 | 116505,5 | 118690,6 | 120558,0 | 122550,7 | 125683,8 | 128864,3 |
| Poland | 9456,1 | 11671,8 | 12129,2 | 12467,3 | 12776,1 | 11960,5* | 12247,6* |
| Caucasus | 9354,8 | 11392,4 | 11735,1 | 12037,2 | 12288,1 | 12512,8, | 12921,7 |
| Siberia | 5784,4 | 7878,5 | 8220,1 | 8719,2 | 9577,9 | 9788,4 | 10000,7 |
| middle Asia | 7747,2 | 9631,3 | 9973,4 | 10107,3 | 10727,0 | 10957,4 | 11103,5 |
| Finland | 2555,5 | 3015,7 | 3030,4 | 3084,4 | 3140,1 | 3196,7 | 3241,0 |
| Total for empires | 129142,1 | 160095,2 | 163778,8 | 167003,4 | 171059,9 | 174009,6 | 178378,8 |
| Without Finland | 126586,6 | 157079,5 | 160748,4 | 163919,0 | 167919,8 | 170902,9 | 175137,8 |
Significant overestimation of population
According to adjusted calculations by the Office of the Chief Medical Officer
inspector of the Ministry of Internal Affairs, population of Russia (without Finland) at the middle of the year
was: 1909 - 156.0 million, 1910 - 158.3 million, 1911 - 160.8 million, 1912
-164.0 million, 1913 - 166.7 million people. (Ni: Sifman
R.I. Uka z. Op. P. 66).
According to estimates of the Office of the Chief Medical Officer
inspector of the Ministry of Internal Affairs, which were based on data on fertility and
mortality, population of Russia (without Finland) as of January 1, 1914
was 174074.9 thousand people, i.e. by about
1.1 million people are less than the data of the Central Committee of the Ministry of Internal Affairs. But the Department also considered this figure
overpriced. The compilers of the Department's "Report" for 1913 noted that
"total population according to local statistical committees
is exaggerated, exceeding the sum of the population figures from the 1897 census and
numbers natural increase over the elapsed time." By calculation
compilers, the population of Russia (without Finland) in mid-1913.
amounted to 166,650 thousand people. (See: Report on the state of public health and medical
aid in Russia in 1913. Pg., 1915. S. 1, 66-67, 98-99).
Table 2a Calculation of the population of Russia (without Finland) for
1897-1914
| Years | Natural growth (adjusted thousand people) | External migration thousand people | population population at the beginning of the year, million | population average annual population million | Natural increase per 100 people average annual population, million |
| 1897 | 2075,7 | -6,9 | 125,6 | 126,7 | 1,79 |
| 1898 | 2010,2 | -15,1 | 127,7 | 128,7 | 1,56 |
| 1899 | 2305,7 | -42,8 | 129,7 | 130,8 | 1,76 |
| 1900 | 2375,2 | -66,7 | 131,9 | 133,1 | 1,78 |
| 1901 | 2184,8 | -19,6 | 134,2 | 135,3 | 1,61 |
| 1902 | 2412,4 | -13,7 | 136,4 | 137,6 | 1,75 |
| 1903 | 2518,0 | -87,2 | 138,8 | 140,0 | 1,80 |
| 1904 | 2582,7 | -70,7 | 141,2 | 142,5 | 1,81 |
| 1905 | 1980,6 | -228,3 | 143,7 | 144,6 | 1,37 |
| 1906 | 2502,5 | -147,4 | 145,5 | 146,7 | 1,71 |
| 1907 | 2769,8 | -139,1 | 147,8 | 149,2 | 1,86 |
| 1908 | 2520,4 | -46,5 | 150,5 | 151,8 | 1,66 |
| 1909 | 2375,6 | -10,8 | 153,0 | 154,2 | 1,54 |
| 1910 | 2266,0 | -105,8 | 155,3 | 153,4 | 1,44 |
| 1911 | 2779,1 | -56,0 | 157,5 | 158,9 | 1,75 |
| 1912 | 2823,9 | -64,8 | 160,2 | 161,6 | 1,75 |
| 1913 | 2754,5 | +25,1 | 163,7 | 164,4 | 1,68 |
| 1914 | 165,7 |
See also sections: “Armed Forces”, “Public Education”
Table 1
Apparent consumption of the most important products in Russia in 1906-1913. (1)
| Years | Wheat | Rye | Barley | oats | Potato | |||||
|---|---|---|---|---|---|---|---|---|---|---|
| total thousand poods. | a penny per soul. | total thousand poods. | a penny per soul. | total thousand poods. | a penny per soul. | total thousand poods. | a penny per soul. | total thousand poods. | per capita | |
| 1906 | 677983 | 4,6 | 966009 | 6,5 | 297117 | 2,0 | 510097 | 3,5 | 1594037 | 10,8 |
| 1907 | 818276 | 5,4 | 1210137 | 8,0 | 369833 | 2,4 | 790936 | 5,2 | 1760268 | 11,6 |
| 1908 | 958141 | 6,1 | 1201128 | 7,7 | 374839 | 2,4 | 822403 | 5,3 | 1814324 | 11,6 |
| 1909 | 1090281 | 6,9 | 1364922 | 8,5 | 449057 | 2,8 | 956798 | 6,0 | 1984479 | 12,5 |
| 1910 | 1008761 | 6,2 | 1317500 | 8,1 | 404033 | 2,5 | 859926 | 5,3 | 2222951 | 13,6 |
| 1911 | 706000 | 4,2 | 1144753 | 6,9 | 318342 | 1,9 | 692066 | 4,2 | 1935434 | 11,6 |
| 1912 | 1171362 | 6,8 | 1604290 | 9,3 | 471712 | 2,7 | 914190 | 5,2 | 2303734 | 13,9 |
| 1913 | 1267595 | 7,1 | 1286763 | 7,2 | 454893 | 2,6 | 876866 | 4,9 | 1749598 | 9,9 |
Table 1 (continued)
| Years | Alcohol | Beer | Sugar | Tea | Coffee | Salt | Tobacco | |||||||
|---|---|---|---|---|---|---|---|---|---|---|---|---|---|---|
| total thousand buckets | buckets per head | total thousand buckets | buckets per head | total thousand poods. | per capita pound. | total thousand poods. | per capita pound. | total thousand poods. | per capita pound. | only million poods. | per capita pound. | total thousand poods. | per capita pound. | |
| 1906 | 84479 | 0,62 | 71456 | 0,50 | 52510 | 144 | 5070 | 1,42 | 666 | 0,19 | - | - | 4562 | 1,2 |
| 1907 | 85926 | 0,63 | 75604 | 0,51 | 53427 | 14,3 | 5612 | 1,48 | 700 | 0,18 | 113,0 | 29,7 | 4396 | 1,2 |
| 1908 | 84980 | 0,61 | 71203 | 0,47 | 58048 | 15,2 | 5276 | 1,36 | 711 | 0,18 | 110,6 | 28,6 | 5311 | 1,4 |
| 1909 | 83271 | 0,58 | 75208 | 0,48 | 60746 | 15,5 | 4481 | 1,12 | 719 | 0,18 | 140,5 | 35,2 | 5169 | 1,3 |
| 1910 | 88369 | 0,60 | 82820 | 0,51 | 71390 | 17,0 | 4085 | 1,00 | 713 | 0,17 | 129,6 | 31,4 | 4820 | 1,2 |
| 1911 | 92573 | 0,56 | 89436 | 0,53 | 72818 | 17,8 | 4216 | 1,01 | 703 | 0,17 | 126,7 | 29,8 | 7060 | 1,7 |
| 1912 | - | - | 86688 | 0,53 | 75489 | 18,0 | 4045 | 0,93 | 723 | 0,16 | 129,1 | 29,9 | 6697 | 1,5 |
| 1913 | - | - | - | - | - | - | 4212 | 0,94 | 697 | 0,17 | - | - | - | - |
Table 1 (continued)
| Years | Cotton | Kerosene | Coal | Cast iron | Copper | Zinc | ||||||
|---|---|---|---|---|---|---|---|---|---|---|---|---|
| total thousand poods. | Per capita pound. | only million poods. | poods per capita | only million poods. | poods per capita | total thousand poods. | poods per capita | total thousand poods. | per capita pound. | total thousand poods. | per capita pound. | |
| 1906 | 18453 | 5,0 | 4590 | 3,1 | 1557 | 10,5 | 175674 | 1,20 | 1386 | 0,4 | 1187 | 0,3 |
| 1907 | 19874 | 5,2 | 482,4 | 3,2 | 1795 | 11,8 | 163904 | 1,10 | 1205 | 0,3 | 1137 | 0,3 |
| 1908 | 19799 | 5,3 | 480,2 | 3,1 | 1820 | 11,7 | 177443 | 1,16 | 1416 | 0,4 | 1277 | 0,3 |
| 1909 | 23189 | 5,9 | 514,9 | 3,2 | 1857 | 11,7 | 180140 | 1,15 | 1481 | 0,4 | 1284 | 0,3 |
| 1910 | 25871 | 6,3 | 536,3 | 3,3 | 1847 | 11,3 | 205538 | 1,27 | 2041 | 0,5 | 1674 | 0,4 |
| 1911 | 25713 | 6,3 | 506,7 | 3,0 | 2067 | 12,3 | 248667 | 1,51 | 2385 | 0,6 | 1244 | 0,3 |
| 1912 | 23941 | 5,4 | 517,0 | 2,9 | 2279 | 13,2 | 295602 | 1,76 | 2401 | 0,6 | - | - |
| 1913 | - | - | 505,2 | 2,8 | 2619 | 15,1 | 323394 | 1,81 | 2811 | 0,6 | - | - |
Source: Statistical Yearbook for 1914. Ed. IN AND. Sharago. St. Petersburg, 1914. P.660
- (1) - The term “apparent consumption” and the methodology for calculating the latter were borrowed by the compilers of the “Statistical Yearbook” from foreign statistics, in which the so-called “apparent consumption” was calculated by adding to the production of a particular product its import from abroad and subtracting from the resulting export amounts. This table does not take into account the export of part of the bread in the form of flour, which constitutes from 0.4 to 0.8 percent of the bread remaining for consumption; Barley consumption also includes the cost of brewing (about 3.5%), and also includes the cost of distilling rye, potatoes and other products (from 9 to 9.5%). When calculating alcohol consumption, its consumption for technical needs, the production of wine and vodka products, and the distillation of alcohol from grapes and fruits is included. For cotton, data on its processing in factories is provided. (A.P. Korelin).
table 2
Annual consumption of staple foodstuffs and industrial goods per capita in Russia in 1913 (in kg)
Source: National economy of the USSR. 1922-1972. Anniversary statistical yearbook. Ed. Central Statistical Office of the USSR. M., 1972. P. 372 (T.M. Kitanina)
Table 3
Meat consumption in Russia in 1912-1913.
| Regions | Number of provinces | Population thousand people | Number of food livestock in terms of cattle | Per capita | Meat consumption, thousand poods | Per capita poods |
|---|---|---|---|---|---|---|
| European Russia | 50 | 127279,4 | 40541,3 | 0,32 | 88669,5 | 0,70 |
| A) | 12917,6 | 54152,9 | 4,19 | |||
| b) | 114361,8 | 34516,6 | 0,30 | |||
| Caucasus | 12 | 12512,8 | 8811,6 | 0,70 | 8556,8 | 0,68 |
| A) | 1314,5 | 4575,4 | 3,48 | |||
| b) | 11198,4 | 3990,4 | 0,36 | |||
| Asian Russia | 17 | 20692,1 | 15600,2 | 0,75 | 14905,7 | 0,72 |
| A) | 1725,6 | 7513,9 | 4,35 | |||
| b) | 18966,5 | 7391,8 | 0,40 | |||
| Poland | 6 | 6471,5 | 1620,8 | 0,25 | 9899,4 | 1,53 |
| A) | 1101,0 | 3417,8 | 3,10 | |||
| b) | 5370,5 | 6481,6 | 1,20 | |||
| By Empire | 85 | 165955,9 | 66573,9 | 0,40 | 122040,4 | 0,74 |
| A) | 16058,8 | 69660,1 | 4,34 | |||
| b) | 149897,1 | 52380,3 | 0,35 |
Source: Statistical materials on the issue of meat consumption in the Russian Empire in 1913. Pg., 1915. Data from the Veterinary Department of the Ministry of Internal Affairs. The report does not include the Kamchatka and Sakhalin regions, as well as 4 of the 10 Polish provinces.
Line a) provides data on provincial (regional) cities and settlements with more than 50,000 people. both sexes; in line b) - for all other villages and localities.
The compiler included information on Polish provinces into a separate group, converted the types of livestock to cattle, calculated the number of livestock per capita, and also clarified per capita meat consumption - up to hundredths of a pood. It is necessary to take into account the inaccuracy of some indicators specified by the department (A.M. Anfimov).
Table 4
Consumption of peasants in European Russia (per person)
Source: Dikhtyar G.A. Internal trade in pre-revolutionary Russia. M., 1960. P.30. The author’s calculations are based on the results budget surveys, carried out by zemstvo statisticians in 1900-1913. (Consumption standards rural population according to budget studies. M., Economic Department of the All-Russian Union of Cities. 1915. P. 1, 2). “The materials of these surveys,” the author notes, “do not allow us to trace either the dynamics of consumption or the differentiation of food consumption by different class groups of the peasantry.”
Table 5
Consumption of peasants in the Tula province according to budget studies of 1911-1914.
| Products | Units | In groups with sowing in the yard | On average per capita for all budgets | ||
|---|---|---|---|---|---|
| measurements | up to 1 dec. | 2-3 dec. | over 15 des. | ||
| Number of budgets | 33 | 75 | 21 | 655 | |
| Rye flour and cereals converted to grain | kg | 219 | 216 | 323 | 250 |
| potatoes | kg | 270 | 266 | 317 | 266 |
| Vegetable oil | kg | 315 | 1,99 | 2,33 | 2,09 |
| Cow butter | kg | 0,3 | 0,6 | 0,6 | 0,6 |
| Milk | kg | 47,1 | 101,1 | 132,8 | 92,4 |
| Meat, lard, poultry | kg | 16,1 | 13,3 | 30,8 | 18,8 |
| Fish | kg | 2,9 | 1,7 | 3,7 | 2,1 |
| Eggs | PC. | 27 | 35 | 34 | 35 |
| Salt | kg | 10,2 | 9,4 | 15,1 | 11,0 |
| Us | kg | 0,3 | 0,2 | 0,4 | 0,3 |
| Sugar | kg | 4,9 | 2,9 | 4,9 | 3,3 |
| Vodka | bottle | 3 | 3 | 8 | 5 |
| Wine | bottle | 0,2 | 0,2 | 0,4 | 0,3 |
| Beer | bottle | 1,0 | 0,7 | 1,8 | 0,7 |
| Population vol. gender | shower | 193 | 477 | 236 | 4765 |
| Food expenses (per capita) | rub. | 35,14 | 33,72 | 53,24 | 37,56 |
| Including money | rub. | 23,45 | 11,83 | 14,84 | 12,53 |
Source: Food supply of the peasant population of the Tula province (according to the monographic description of 1911-1914). Tula, 1907. We made the translation to metric measures. (A.M. Anfimov).
Table 6
Consumption of workers of the Seredsky factory district of the Kostroma province depending on the annual income of the workers (1911)
Source: Dikhtyar G.A. Internal trade in pre-revolutionary Russia. M., 1960. P.56
Table 7
Average per capita consumption of essential food products in Moscow in 1898-1912. (pd. per year)
Source: Consumption of the most important consumer products in Moscow. Statistical Department of the Moscow City Government. Vol. IV. M., 1916. S. 14, 15. (A.P. Korelin)
(1) - With an absolute increase in meat consumption over 10 years, per capita consumption decreased by 20%. At 184 pounds per year, the average daily per capita consumption was a little over 1/2 pound (48.5 spools). 10 years ago it was 205 pounds. per year, i.e. 5 pud.
(2) - Based on 1 pood of 40 pieces of herring.
Table 8
Average annual consumption of essential food products by the Moscow population over five years in 1898-1912. (thousand poods)
| Years | Population (thousand people) abs. / V % | Wheat flour | Rye flour | cereals | Potato | Fish | Sugar | Meat |
|---|---|---|---|---|---|---|---|---|
| 1898-1902 | 1129 | 5389 | 7209 | 2316 | 3018 | 1626 | 2276 | 5853 |
| 100 | 100 | 100 | 100 | 100 | 100 | 100 | 100 | |
| 1903-1907 | 1299 | 6702 | 8172 | 2058 | 3068 | 1769 | 2289 | 6266 |
| 115,0 | 124,4 | 113,3 | 88,8 | 101,6 | 108,8 | 144,5 | 107,0 | |
| 1908-1912 | 1526 | 7393 | 8463 | 1987 | 3773 | 2027 | 3077 | 7071 |
| 135,2 | 137,2 | 117,4 | 35,8 | 125,0 | 124,7 | 135,2 | 120,8 |
Source: Consumption of the most important consumer products in Moscow. Statistical Department of the Moscow City Duma. Vol. IV. M., 1916. S. 5, 7, 10, 21, 23, 25, 27, 31, 32. (A.P. Korelin).
Table 9
Production and consumption of alcohol in Russia in 1912-1913. (buckets 40 degrees)
| Number of provinces | Production of thousand buckets | Consumption of thousand buckets | Per capita converted to liter | |
|---|---|---|---|---|
| European Russia | 50 | 100104 | 86071 | 8,2 |
| Caucasus | 3 | 2164 | 3922 | 8,6 |
| Transcaucasia | 2 | 57 | 371 | 2,9 |
| Western Siberia | 4 | 4097 | 5702 | 7,5 |
| Eastern Siberia | 2 | 1578 | 1513 | 11,0 |
| Priamursky region | 2 | 617 | 1049 | 15,0 |
| Turkestan | 3 | 308 | 562 | 1,7 |
| Total | 66 | 108875 | 98640 | 8,0 |
Source: Collection of statistical and economic information on agriculture in Russia and foreign countries. Pg., 1917. S. 183-195. In Transcaucasia - data for Tiflis and Kutaisi provinces, in Western Siberia- in Tobolsk, Tomsk, Yenisei provinces. and in the Akmola region, in Eastern Siberia- in the Irkutsk province. and Transbaikal region, in the Amur region - in the Amur and Primorsky regions, in Turkestan - in the Semipalatinsk, Semirechensk and Syr-Darya regions. 1 bucket = 12.3 liters.
Table 9a
Alcohol consumption in Russia per capita of both sexes
| Year | Veder (in 40-degree terms) | Converted to liters | Price 1 liter (kopecks) | Net treasury income (million rubles) |
|---|---|---|---|---|
| 1903 | 0,52 | 6,4 | - | - |
| 1904 | 0,51 | 6,3 | - | - |
| 1905 | 0,53 | 6,5 | 18 | 443 |
| 1906 | 0,60 | 7,4 | - | 506 |
| 1907 | 0,59 | 7,3 | - | 511 |
| 1908 | 0,57 | 7,0 | - | 509 |
| 1909 | 0,55 | 6,8 | - | 527 |
| 1910 | 0,56 | 6,9 | - | 574 |
| 1911 | 0,56 | 6,9 | 16 | 597 |
| 1912 | 0,58 | 7,1 | 16 | 626 |
| 1913 | 0,60 | 7,4 | 17 | 675 |
Source: National economy in 1913. Pg., 1914. P. 97, 103, 106.
- Bucket = 12.3 liters (A.M.Anfimov)
From the “Explanatory Note to the State Control Report on the Execution state painting and financial estimates for 1913" Pg., 1914., pp. 196-198
Sugar consumption
Our sugar consumption cannot but be considered extremely insufficient, for on average it amounts to only 17-19 pounds per year per person, while in England it reaches 100 pounds, in Germany - 52 pounds, in France - 43 pounds, and in Austria - 31 lbs.
This phenomenon is explained primarily by the low availability of sugar for the population due to its high cost on sale.
According to the law on our current rationing, for each year the amount of sugar to be released into the domestic market, the size of emergency reserves of sugar at factories and the maximum prices for sugar within the country are predetermined, if exceeded, the release of sugar from the reserve is allowed.
These conditions cannot but help keep prices at elevated levels, which in turn slows down consumption growth. (Sugar prices on the Kiev market in 1913-1914 ranged from 3 rubles 87 kopecks to 4 rubles 04 kopecks per pood).
Table 1c
Annual earnings of industrial and agricultural workers by regions of European Russia in 1901-1910.
| Number of provinces | Annual agricultural income worker in 1881-1891(1) | In 1901 | In 1910 | |||||
|---|---|---|---|---|---|---|---|---|
| prom. worker, rub. (2) | agricultural worker, rub. (3) | % of industrial earnings working | prom. worker, rub. (4) | agricultural worker, rub. (5) | % of industrial earnings working | |||
| Northern | 3 | 63 | 191 | 49 | 25,6 | 254 | 146 | 57,5 |
| Northwestern | 3 | 77 | 291 | 65 | 22,3 | 337 | 150 | 44,5 |
| West | 6 | 45 | 172 | 51 | 30,2 | 215 | 129 | 60,0 |
| Baltic | 3 | 82 | 278 | 94 | 33,8 | 315 | 216 | 68,6 |
| Industrial | 6 | 64 | 183 | 71 | 38,8 | 217 | 148 | 68,2 |
| Middle Volga | 4 | 58 | 173 | 54 | 31,2 | 190 | 122 | 64,2 |
| Severochernozemny | 7 | 52 | 118 | 52 | 44,1 | 182 | 120 | 65,9 |
| South Chernozem | 3 | 60 | 166 | 59 | 35,5 | 183 | 126 | 68,8 |
| Southwestern | 3 | 42 | 96 | 51 | 53,1 | 147 | 116 | 78,9 |
| Southern steppe | 5 | 89 | 293 | 87 | 29,7 | 371 | 165 | 44,5 |
| Nizhnevolzhsky | 7 | 61 | 199 | 53 | 26,6 | 150 | 130 | 86,7 |
| Total for European Russia | 50 | 61 | 197 | 62 | 31,5 | 233 | 143 | 61,4 |
| According to Non-Chernozem. lane | 25 | 63 | 210 | 63 | 30,0 | 241 | 147 | 61,0 |
| By Chernozem. lane | 25 | 61 | 158 | 60 | 38,0 | 203 | 132 | 65,0 |
(1)- Agricultural and statistical information based on materials received from the owners. Vol. V. Free-hired labor on owner-occupied farms and the movement of workers in connection with a socio-economic overview of European Russia in agricultural and industrial relations. Comp. S.A. Korolenko. St. Petersburg, 1892. Applications. pp. 142-143.
(2) - Set of reports of factory inspectors for 1901. St. Petersburg, 1903. pp. 162-165.
(3) - Materials of the highest commission established on November 16, 1901 to study the issue of movement from 1861 to 1900. the well-being of the rural population of the average agricultural provinces in comparison with other areas of European Russia. St. Petersburg, 1903. Ch.P.
(4) - Set of reports of factory inspectors for 1910. St. Petersburg, 1911. P.280-283.
(5) - Labor prices in agriculture private owners of European or Asian Russia in 1910. St. Petersburg, 1913. S.P. HP. (A.M. Anfimov).
Table 11
Distribution of workers (in%) by earnings in June 1914 in various groups of production
| Production groups | Size daily earnings working | ||||||
|---|---|---|---|---|---|---|---|
| up to 50 kopecks | 50 k. - 1 rub. | 1 rub. - 2 r. | 2 p. - Zr. | 3 p. - 4 rub. | 4 p. - 5 rub. | over 5r. | |
| Cotton processing | 14,4 | 62,3 | 21,6 | 1,4 | 0,2 | 0,05 | 0,04 |
| Wool processing | 36,2 | 44,4 | 18,2 | 1,0 | 0,07 | 0,03 | 0,06 |
| Silk processing | 27,3 | 55,4 | 16,3 | 1,0 | 0,05 | 0,01 | - |
| Processing of flax, hemp and jute | 35,5 | 52,4 | 11,5 | 0,5 | 0,05 | 0,01 | - |
| Mixed production for processing fibrous substances | 3,3 | 48,0 | 38,4 | 9,1 | 0,8 | 0,3 | 0,1 |
| Paper and printing production | 18,7 | 40,5 | 28,9 | 8,6 | 2,2 | 0,7 | 0,4 |
| Mechanical processing of wood | 7,3 | 34,2 | 45,5 | 10,7 | 1,6 | 0,5 | 0,2 |
| Metal processing, machine production | 4,6 | 17,9 | 41,8 | 23,1 | 7,9 | 3,2 | 1,5 |
| Mineral processing | 24,2 | 37,4 | 31,4 | 5,3 | 0,8 | 0,3 | 0,6 |
| Processing of animal products | 15,0 | 34,0 | 33,7 | 13,2 | 3,2 | 0,8 | 0,1 |
| Processing of food and flavoring substances | 22,8 | 49,6 | 23,8 | 2,9 | 0,6 | 0,2 | 0,1 |
| Chemical production | 14,7 | 35,5 | 40,8 | 7,2 | 1,4 | 0,3 | 0,1 |
| Mining industry | 0,2 | 47,7 | 38,7 | 8,2 | 3,6 | 1,0 | 0,6 |
| Productions not included in previous groups | 0,8 | 20,6 | 53,0 | 16,9 | 6,5 | 1,9 | 0,3 |
| Total | 16,4 | 46,5 | 27,4 | 6,7 | 1,9 | 0,7 | 0,4 |
Source: Earnings of factory workers in Russia (June 1914 and June 1916). Vol. 1., M., 1918. P.20-21 (Calculations by N.A. Ivanova).
Table 12
Average annual salary in rubles. workers of various industries of the factory industry of European Russia in 1910-1913.
| Production groups | 1910 | 1911 | 1912 | 1913 |
|---|---|---|---|---|
| 1. Cotton processing | 218 | 218 | 220 | 215 |
| 2. Wool processing | 239 | 246 | 245 | 210 |
| 3. Silk processing | 218 | 212 | 223 | 208 |
| 4. Processing of flax, hemp and jute | 169 | 170 | 180 | 192 |
| 5. Mixed production for processing fibrous substances. | 285 | 276 | 272 | 209 |
| 6. Production: paper, paper products and printing. | 277 | 283 | 288 | 261 |
| 7. Mechanical processing of wood. | 250 | 256 | 258 | 249 |
| 8. Metal processing | 380 | 397 | 400 | 402 |
| 9. Processing of minerals | 224 | 233 | 239 | 261 |
| 10. Processing of animal products. | 294 | 296 | 300 | 303 |
| 11. Nutrient and flavor processing | 149 | 159 | 156 | 189 |
| 12. Chemical production | 260 | 268 | 273 | 249 |
| 13. Oil production and oil drilling | 370 | 309 | 338 | 366 |
| 14. Other production not included in previous groups | 424 | 438 | 403 | 443 |
| For all production groups | 243 | 251 | 255 | 264 |
Along with the collapse of the Russian Empire, the majority of the population chose to create independent national states. Many of them were never destined to remain sovereign, and they became part of the USSR. Others were incorporated into the Soviet state later. What was the Russian Empire like at the beginning? XXcentury?
By the end of the 19th century, the territory of the Russian Empire was 22.4 million km 2. According to the 1897 census, the population was 128.2 million people, including the population of European Russia - 93.4 million people; Kingdom of Poland - 9.5 million, - 2.6 million, Caucasus Territory - 9.3 million, Siberia - 5.8 million, Central Asia - 7.7 million people. Over 100 peoples lived; 57% of the population were non-Russian peoples. The territory of the Russian Empire in 1914 was divided into 81 provinces and 20 regions; there were 931 cities. Some provinces and regions were united into governorates-general (Warsaw, Irkutsk, Kiev, Moscow, Amur, Stepnoe, Turkestan and Finland).
By 1914, the length of the territory of the Russian Empire was 4383.2 versts (4675.9 km) from north to south and 10,060 versts (10,732.3 km) from east to west. The total length of the land and sea borders is 64,909.5 versts (69,245 km), of which the land borders accounted for 18,639.5 versts (19,941.5 km), and the sea borders accounted for about 46,270 versts (49,360 .4 km).
The entire population was considered subjects of the Russian Empire, the male population (from 20 years old) swore allegiance to the emperor. The subjects of the Russian Empire were divided into four estates (“states”): nobility, clergy, urban and rural inhabitants. Local population Kazakhstan, Siberia and a number of other regions were allocated to an independent “state” (foreigners). The coat of arms of the Russian Empire was a double-headed eagle with royal regalia; the state flag is a cloth with white, blue and red horizontal stripes; The national anthem is “God Save the Tsar.” National language - Russian.
Administratively, the Russian Empire by 1914 was divided into 78 provinces, 21 regions and 2 independent districts. The provinces and regions were divided into 777 counties and districts and in Finland - into 51 parishes. Counties, districts and parishes, in turn, were divided into camps, departments and sections (2523 in total), as well as 274 landmanships in Finland.
Territories that were important in military-political terms (metropolitan and border) were united into viceroyalties and general governorships. Some cities were allocated into special administrative units - city governments.
Even before the transformation of the Grand Duchy of Moscow into the Russian Kingdom in 1547, at the beginning of the 16th century, Russian expansion began to go beyond the boundaries of its ethnic territory and began to absorb the following territories (the table does not indicate lands lost before early XIX century):
|
Territory |
Date (year) of accession to the Russian Empire |
Data |
|
Western Armenia (Asia Minor) |
The territory was ceded in 1917-1918 |
|
|
Eastern Galicia, Bukovina (Eastern Europe) |
ceded in 1915, partially recaptured in 1916, lost in 1917 |
|
|
Uriankhai region (Southern Siberia) |
Currently part of the Republic of Tuva |
|
|
Franz Josef Land, Emperor Nicholas II Land, New Siberian Islands (Arctic) |
The archipelagos of the Arctic Ocean are designated as Russian territory by a note from the Ministry of Foreign Affairs |
|
|
Northern Iran (Middle East) |
Lost as a result of revolutionary events and the Russian Civil War. Currently owned by the State of Iran |
|
|
Concession in Tianjin |
Lost in 1920. Currently a city directly under the People's Republic of China |
|
|
Kwantung Peninsula (Far East) |
Lost as a result of defeat in the Russo-Japanese War of 1904-1905. Currently Liaoning Province, China |
|
|
Badakhshan (Central Asia) |
Currently, Gorno-Badakhshan Autonomous Okrug of Tajikistan |
|
|
Concession in Hankou (Wuhan, East Asia) |
Currently Hubei Province, China |
|
|
Transcaspian region (Central Asia) |
Currently belongs to Turkmenistan |
|
|
Adjarian and Kars-Childyr sanjaks (Transcaucasia) |
In 1921 they were ceded to Turkey. Currently Adjara Autonomous Okrug of Georgia; silts of Kars and Ardahan in Turkey |
|
|
Bayazit (Dogubayazit) sanjak (Transcaucasia) |
In the same year, 1878, it was ceded to Turkey following the results of the Berlin Congress. |
|
|
Principality of Bulgaria, Eastern Rumelia, Adrianople Sanjak (Balkans) |
Abolished following the results of the Berlin Congress in 1879. Currently Bulgaria, Marmara region of Turkey |
|
|
Khanate of Kokand (Central Asia) |
Currently Uzbekistan, Kyrgyzstan, Tajikistan |
|
|
Khiva (Khorezm) Khanate (Central Asia) |
Currently Uzbekistan, Turkmenistan |
|
|
including Åland Islands |
Currently Finland, the Republic of Karelia, Murmansk, Leningrad regions |
|
|
Tarnopol District of Austria (Eastern Europe) |
Currently, Ternopil region of Ukraine |
|
|
Bialystok District of Prussia (Eastern Europe) |
Currently Podlaskie Voivodeship of Poland |
|
|
Ganja (1804), Karabakh (1805), Sheki (1805), Shirvan (1805), Baku (1806), Kuba (1806), Derbent (1806), northern part of the Talysh (1809) Khanate (Transcaucasia) |
Vassal khanates of Persia, capture and voluntary entry. Secured in 1813 by a treaty with Persia following the war. Limited autonomy until the 1840s. Currently Azerbaijan, Nagorno-Karabakh Republic |
|
|
Imeretian kingdom (1810), Megrelian (1803) and Gurian (1804) principalities (Transcaucasia) |
Kingdom and principalities of Western Georgia (independent from Turkey since 1774). Protectorates and voluntary entries. Secured in 1812 by a treaty with Turkey and in 1813 by a treaty with Persia. Self-government until the end of the 1860s. Currently Georgia, Samegrelo-Upper Svaneti, Guria, Imereti, Samtskhe-Javakheti |
|
|
Minsk, Kiev, Bratslav, eastern parts of Vilna, Novogrudok, Berestey, Volyn and Podolsk voivodeships of the Polish-Lithuanian Commonwealth (Eastern Europe) |
Currently, Vitebsk, Minsk, Gomel regions of Belarus; Rivne, Khmelnitsky, Zhytomyr, Vinnitsa, Kiev, Cherkassy, Kirovograd regions of Ukraine |
|
|
Crimea, Edisan, Dzhambayluk, Yedishkul, Little Nogai Horde (Kuban, Taman) (Northern Black Sea region) |
Khanate (independent from Turkey since 1772) and nomadic Nogai tribal unions. Annexation, secured in 1792 by treaty as a result of the war. Currently Rostov region, Krasnodar region, Republic of Crimea and Sevastopol; Zaporozhye, Kherson, Nikolaev, Odessa regions of Ukraine |
|
|
Kuril Islands (Far East) |
Tribal unions of the Ainu, bringing into Russian citizenship, finally by 1782. According to the treaty of 1855, the Southern Kuril Islands are in Japan, according to the treaty of 1875 - all the islands. Currently, the North Kuril, Kuril and South Kuril urban districts of the Sakhalin region |
|
|
Chukotka (Far East) |
Currently Chukotka Autonomous Okrug |
|
|
Tarkov Shamkhaldom (North Caucasus) |
Currently the Republic of Dagestan |
|
|
Ossetia (Caucasus) |
Currently Republic North Ossetia- Alania, Republic of South Ossetia |
|
|
Big and Small Kabarda |
Principalities. In 1552-1570, a military alliance with the Russian state, later vassals of Turkey. In 1739-1774, according to the agreement, it became a buffer principality. Since 1774 in Russian citizenship. Currently Stavropol region, Kabardino-Balkarian Republic, Chechen Republic |
|
|
Inflyantskoe, Mstislavskoe, large parts of Polotsk, Vitebsk voivodeships of the Polish-Lithuanian Commonwealth (Eastern Europe) |
Currently, Vitebsk, Mogilev, Gomel regions of Belarus, Daugavpils region of Latvia, Pskov, Smolensk regions of Russia |
|
|
Kerch, Yenikale, Kinburn (Northern Black Sea region) |
Fortresses, from the Crimean Khanate by agreement. Recognized by Turkey in 1774 by treaty as a result of war. The Crimean Khanate gained independence from the Ottoman Empire under the patronage of Russia. Currently, the urban district of Kerch of the Republic of Crimea of Russia, Ochakovsky district of the Nikolaev region of Ukraine |
|
|
Ingushetia (North Caucasus) |
Currently the Republic of Ingushetia |
|
|
Altai (Southern Siberia) |
Currently Altai region, Altai Republic, Novosibirsk, Kemerovo, Tomsk regions of Russia, East Kazakhstan region of Kazakhstan |
|
|
Kymenygard and Neyshlot fiefs - Neyshlot, Vilmanstrand and Friedrichsgam (Baltics) |
Flax, from Sweden by treaty as a result of the war. Since 1809 in the Russian Grand Duchy of Finland. Currently Leningrad region Russia, Finland (South Karelia region) |
|
|
Junior Zhuz (Central Asia) |
Currently, the West Kazakhstan region of Kazakhstan |
|
|
(Kyrgyz land, etc.) (Southern Siberia) |
Currently the Republic of Khakassia |
|
|
Novaya Zemlya, Taimyr, Kamchatka, Commander Islands (Arctic, Far East) |
Currently Arkhangelsk region, Kamchatka, Krasnoyarsk territories |
The summer heat and political coolness provide an opportunity to step back a little from the bustle and look at our problems from some distance, from some perspective.
It is always interesting to somehow evaluate “Russia’s path” over the past 100 years. Usually like this general grades are reduced to emotional and empty chatter, with an eternal search for those to blame and preaching of previously known saving truths. But there is a way to avoid the temptation of such childish games. To do this, you need to turn not to emotions, but to FACTS AND FIGURES. Real data, not manipulated to fit a ready-made answer, gives reason not to “ring like a bell on a veche tower,” but to think...
Let's take one of the main, integral resources of any state - population. This is what the last 100 years of our country's development look like when you look at it from this angle.
In 1914, the population of the Russian Empire was, according to some estimates (data from our State Statistics Committee), 166 million people, according to others (Ministry of Internal Affairs of the Empire) - 178 million. The population of the Earth then was 1782 million people. That is, the Russian Empire included about 10% of Humanity. For comparison: the population of the United States at that time was about 100 million. The Russian Empire was the third largest country in the world - after China and India. As for the population of Russia within its current borders, on the eve of the First World War it was 90 million people. - more than half of the Empire’s inhabitants, 5% of the Earth’s population.
Now the Russian Federation has 143 million people. - gives a little more than 2% of the world's population, Russia is the 9th most populous country in the world. At the same time, if we imagine a country within the borders of that Russian Empire - that is, the USSR plus Finland and most of Poland - then its population would be 316 million people, approximately 4.5% of the world's population, tied for 3rd-4th place by number of residents from the USA.
Despite all the conventionality of such “calculations,” the question invariably arises: is this good or bad?
Public consciousness in our - and, I think, not only in our - country still lives according to the principle “more is better than less!” Hence all the gasps for the lost Big Country, imperial nostalgia, “the catastrophe of the collapse of the USSR.”
Meanwhile, for any pleasure you have to pay.
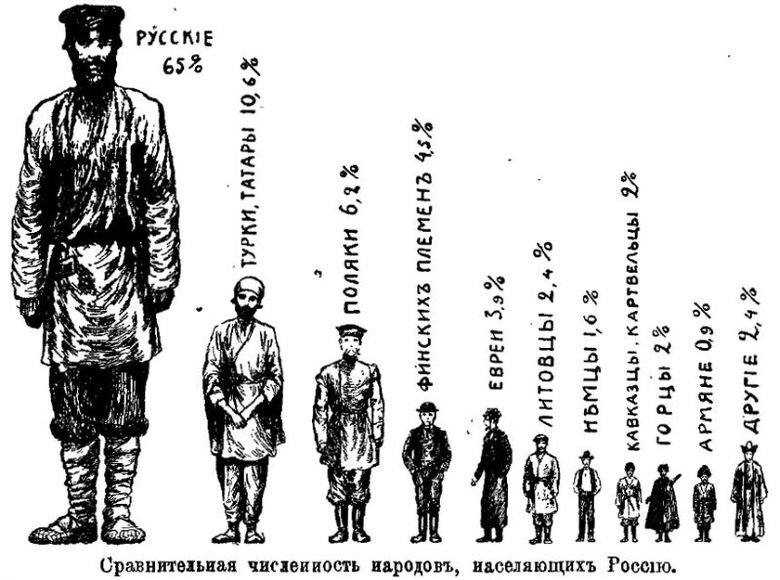
For example, in the Russian Empire in 1914, over 70% of the population were Orthodox (Russians - about 45%, Ukrainians, Belarusians), 11% were Muslims, about 15% were Catholics and Lutherans, 4% were Jews.
Today, almost 80% of the population of the Russian Federation are Russians (about 114 million out of 143 million) and a little more than 10% are Muslims. But as part of the Great Empire, Russians (in total in the territory former USSR There are about 130 million of them) would make up a little more than 40% of the population. But the share of Muslims, compared to the 1914 Empire, would have increased from 11 to 30% - about 90 million people. (the population of Central Asia has tripled in 100 years). Would such a Russian-Muslim Eurasia become a stable state or would it be fraught with collapse?
Perhaps the collapse of the USSR itself objectively became the payment for the SALVATION of Russia as a state of Russian culture (not to be confused with the racist slogan “Russia for Russians”). It would be difficult to maintain the dominance of Russian culture in the country for a long time, given that Russians make up no more than 40% of the country's population. (By the way, references to the USA are not very convincing - firstly, there are generally different traditions there, and secondly, “English culture” and the “Anglo-Saxon elite” do not dominate in the modern USA.)
What can be said about the “demographic hole” that, as is often said, became the 20th century for Russia with its wars and terror?
100 years ago the population of England was 45 million, France - 39 million, Germany - 65 million.
Now, respectively, England - 61 million, France - 64 million, Germany - 82 million. Growth from 60% (France) to 30% (Germany). The population of Russia within the unchanged borders of the Russian Federation has grown by 60%. Can this be considered a demographic catastrophe compared to other European countries?
These numbers, it seems to me, destroy our inflated (positively or negatively) self-esteem.
It turns out that any WILLED effort is insignificant compared to the inaudible demographic “ELEMENT”: the government is noisy, crackling, puffing up, heroically exterminating the people, and women are just giving birth. And the ship of the state floats with the flow, and it is not the current that obeys the ship’s engine.
Until the 1960-1970s, Russia maintained high, peasant-patriarchal birth rates. Only in 1960 more than half of the Russian population became city dwellers (in Europe this happened decades earlier, and in England even in the 19th century). Now only 25% of the Russian population lives in villages. Peasant civilization ended - birth rates gradually changed (by the way, in the villages too) - now they are 11.1 births per 1000 population. For comparison, in France - 12.4 per 1000 (partly due to Arabs), in England - 10.6, in Germany - 8.2. Accordingly, population growth began to decrease, and after 1991, thanks to a sharp increase in mortality in the conditions of social unrest, negative growth began. In terms of mortality rate - 16 deaths per 1000 people, Russia is between Nigeria and Chad. Mortality in old Europe: in France 8.6 per 1000 people, in England 10, and in Germany 11 people. by 1000.
As a result, Russia's population is declining, although not as dramatically as they say: from 1991 to 2010 - by 7 million, or less than 5%.
Of course, Russia's population growth of 60% in the 20th century was far from uniform. It wasn't just people who moved from village to city. Population densities have changed dramatically in different regions.
Thus, the number of residents of Siberia and the Far East tripled: from 10 million at the beginning of the 20th century to approximately 30 million at the beginning of the 21st. You can say - “there was no happiness - misfortune helped.” This growth is an obvious “involuntary” result of forced relocation: exile during collectivization, evacuation during the war, terror with millions of prisoners, many of whom settled in a new place. Nevertheless, these lands remained sparsely populated: “vastness, vain without inhabitants” (Lomonosov). This especially applies to the Far East: the population density is about 1 person. per kilometer! If this were the case throughout the country, the population of Russia would be 17 million, and if in the Far East the density was the same as in the Central District (about 56 people per kilometer), then more than 350 million people would live there!
The greatest growth over this century, of course, occurred in Moscow. In 1914 - 1,763,000 people, in 2010 - about 11 million permanent residents alone, an increase of more than 6 times (and with temporary and unregistered Muscovites - almost 8 times). All this made Moscow the largest and most unbearable metropolis in Europe to live in... (By the way, the population of St. Petersburg has only slightly doubled over the years.)
But the staid, “Central Russian” Russia was downright depopulated. For example, in the Smolensk region, 2,166,000 people lived within its modern borders in 1926, now - 966,000. In the Kostroma province in 1914, the population was 1,800,000, now - 692,000. These are typical examples. One-story Russia, where the roots of Russian culture grow, has almost disappeared. And a largely different country arose in the same place...